R in 3 Months
Week 11
Advanced Data Viz Part 2
Agenda
Agenda
- Housekeeping
Agenda
Housekeeping
ggtextexample
Agenda
Housekeeping
ggtextexampleGroup work
Agenda
Housekeeping
ggtextexampleGroup work
Next week
Housekeeping
Remaining Schedule
Remaining Schedule
Week 12
Office hours
Live session (December 8th)
Remaining Schedule
Week 12
Office hours
Live session (December 8th)
Week 13
Office hours
Last Live session (December 15th)
Remaining Schedule
Week 12
Office hours
Live session (December 8th)
Week 13
Office hours
Last Live session (December 15th)
Assignments
- Please submit before end of December
Example Data Viz with {ggtext}
Dumbbell charts and {ggtext}
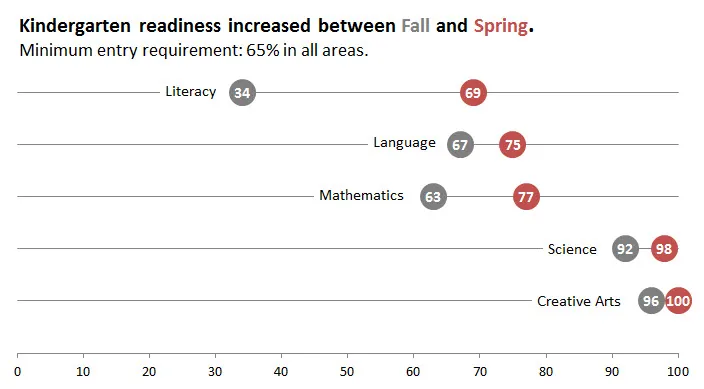
Let's walk through building this beautiful chart from Stephanie Evergeen in {ggplot2}.
This is a dumbell chart that uses colour in the title in place of a legend. We can do this using {ggtext}

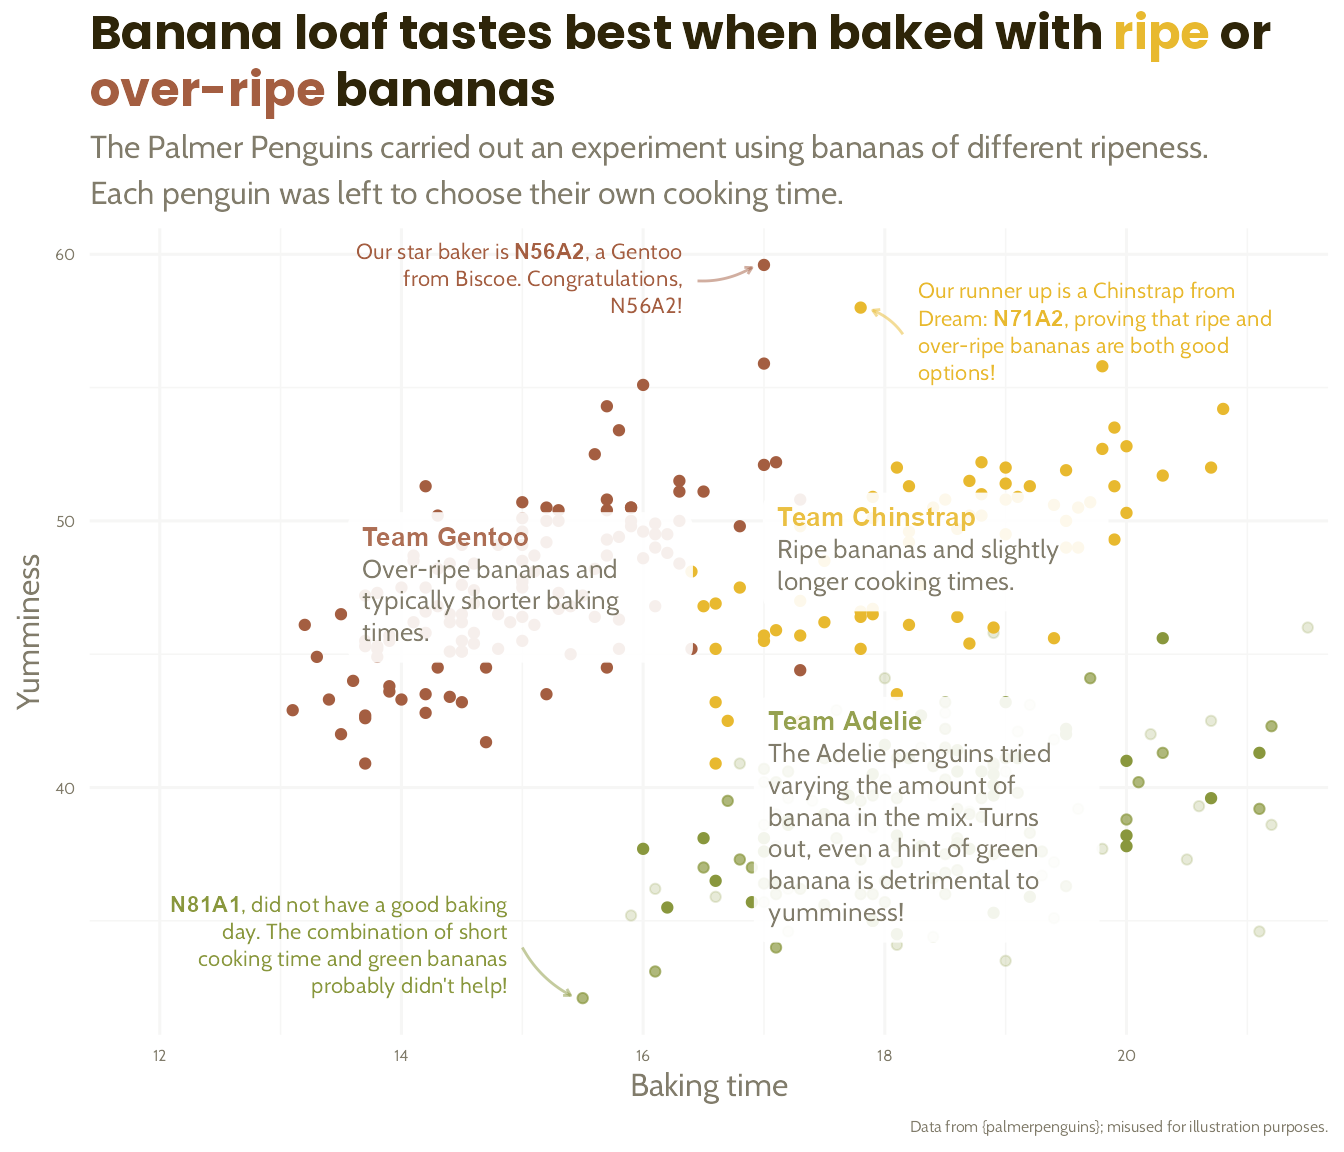
Doing even more with {ggtext}
Our colleague Cara Thompson ran an incredible workshop at NHS-R in November 2022 about levelling up your charts [with {ggtext}].
You can watch the video and view Cara's slides on her website.

Group work
Group work
Group work
Your task is decipher how I made this graph

- Why is the y aesthetic property set to 1?
Group work
Your task is decipher how I made this graph

Why is the y aesthetic property set to 1?
What does shape = 124 do?
Group work
Your task is decipher how I made this graph

Why is the y aesthetic property set to 1?
What does shape = 124 do?
What does geom_hline() do in this viz?
Group work
Your task is decipher how I made this graph

Why is the y aesthetic property set to 1?
What does shape = 124 do?
What does geom_hline() do in this viz?
Why do I have to specifically add x axis text using the line
theme(axis.text.x = element_text(color = "grey80"))?
Group work
Your task is decipher how I made this graph

Why is the y aesthetic property set to 1?
What does shape = 124 do?
What does geom_hline() do in this viz?
Why do I have to specifically add x axis text using the line
theme(axis.text.x = element_text(color = "grey80"))?
Next Week
Next Week
Course assignment: Complete lessons on advanced RMarkdown